
Introduction to C&I Energy Storage and Peak Shaving
Commercial and industrial (C&I) electricity consumers face a structural cost problem: demand charges and time-of-use (TOU) rates mean that a small fraction of operating hours accounts for a disproportionate share of the monthly bill. In many U.S. utility territories, peak demand charges can represent 30–50% of a commercial electricity bill, even though peak periods last only a few hours per day. Peak shaving addresses this directly by discharging stored energy during high-tariff windows, reducing the maximum import from the grid. A 1MWh containerizedsystem has become a practical reference point because it aligns with the load profile of mid-sized facilities — manufacturing plants, cold storage warehouses, data centers, and large retail campuses — where peak demand typically falls between 500kW and 2MW.
Key Features of 1MWh Containerized Systems
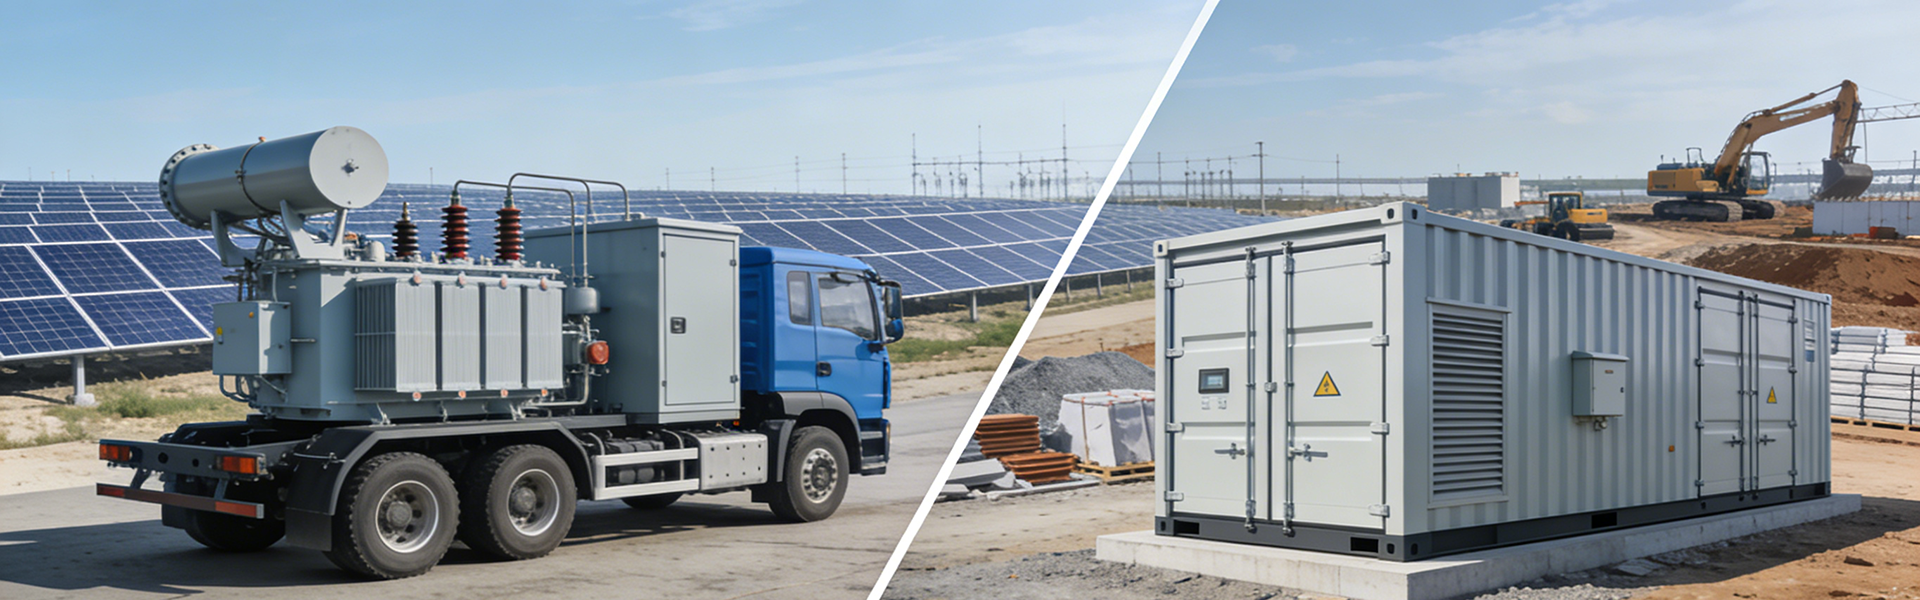
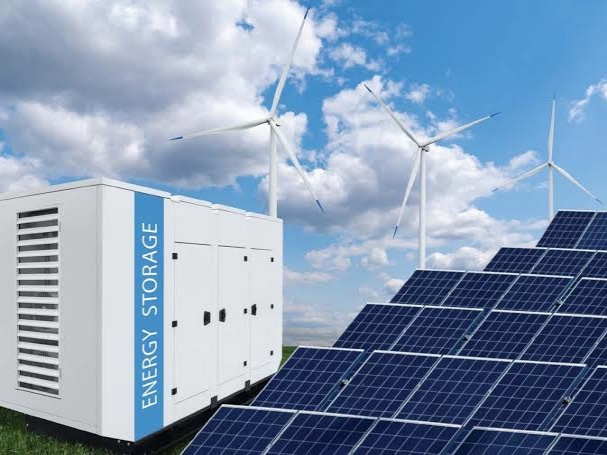
A 1MWh container energy storage systerm is typically built around a 20-foot or 40-foot ISO high-cube enclosure, integrating battery racks, a power conversion system (PCS), thermal management, and fire suppression. The DC-to-AC round-trip efficiency of modern lithium iron phosphate (LFP) systems generally ranges from 88% to 92%, while cycle life at 80% depth of discharge (DoD) reaches 6,000–8,000 cycles. Containerization reduces civil works and installation time compared with rack-based indoor builds, and it enables factory pre-testing before shipment. The table below compares typical configurations across three system tiers.
| Parameter | 500kWh | 1MWh | 2MWh |
|---|---|---|---|
| Nominal PCS power | 250kW | 500kW | 1,000kW |
| Footprint | 10-ft container | 20-ft container | 40-ft container |
| Typical round-trip efficiency | 88–90% | 89–91% | 90–92% |
| Estimated installation周期 | 4–6 weeks | 6–8 weeks | 8–12 weeks |
Benefits of Peak Shaving for Commercial and Industrial Users
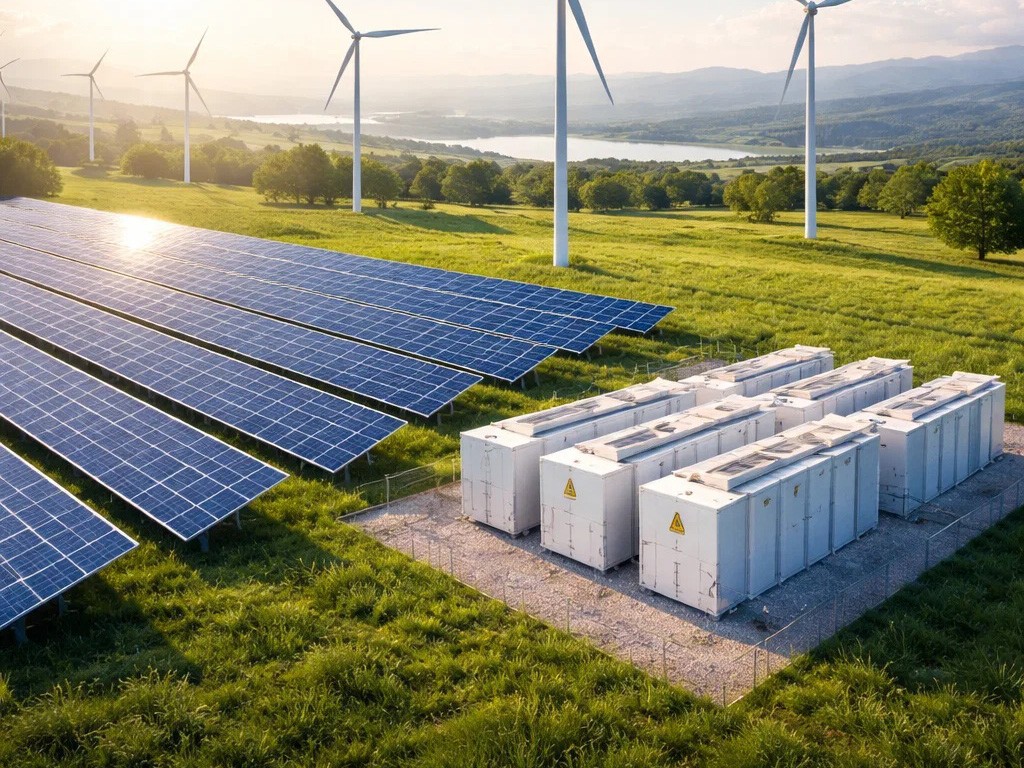
The economics of peak shaving depend on the spread between off-peak and on-peak tariffs. Where that spread exceeds $0.15/kWh, a 1MWh system cycling once per day can generate $40,000–$55,000 in annual energy arbitrage value, before accounting for demand charge reduction. Demand charge savings are often larger: shaving 500kW of peak demand at $15/kW-month yields $90,000 per year. Beyond direct savings, the system provides power quality benefits — voltage support, reduced transformer loading, and backup capability during outages. Facilities with high solar penetration can also use the container to absorb excess PV generation that would otherwise be curtailed or exported at low value.
OEM Considerations for Customized Energy Storage Solutions
Selecting an OEM partner involves trade-offs that go beyond unit price. Cell chemistry, PCS topology, and EMS software determine whether a system can actually deliver the promised cycle life under real operating conditions. Buyers should verify whether the OEM manufactures the battery modules in-house or sources them from third parties, since this affects warranty enforcement and spare parts availability. Communication protocols matter as well: a system that supports Modbus TCP, IEC 61850, and open API access integrates more easily with existing building management systems. Thermal management strategy — air cooling versus liquid cooling — also affects derating behavior in ambient temperatures above 35°C. Finally, OEMs that offer modular expansion allow capacity to grow from 1MWh to 2MWh without replacing the PCS or enclosure.
Conclusion and Future Outlook
Falling battery prices and rising demand charges continue to improve the payback period for C&I peak shaving, with many projects now reaching 5–7 years in favorable tariff regions. The 1MWh container format is likely to remain a standard building block as OEMs push toward higher energy density and longer cycle life.